Picking objectives by CPM — a 12-month benchmark
Mapping Facebook CPM by objective over a full year to drive smarter media planning.
Overview
This is a Meta · Media planning case study for a all client, run by Muhammad Naveed over 12 months. The headline result was 5× cpm spread by objective. A 12-month benchmark mapping Facebook CPM across ad objectives to guide smarter media planning decisions.
Clients kept asking 'why is my CPM so high?' without context. There was no internal benchmark to push back against unrealistic objective choices.
The numbers, side by side.
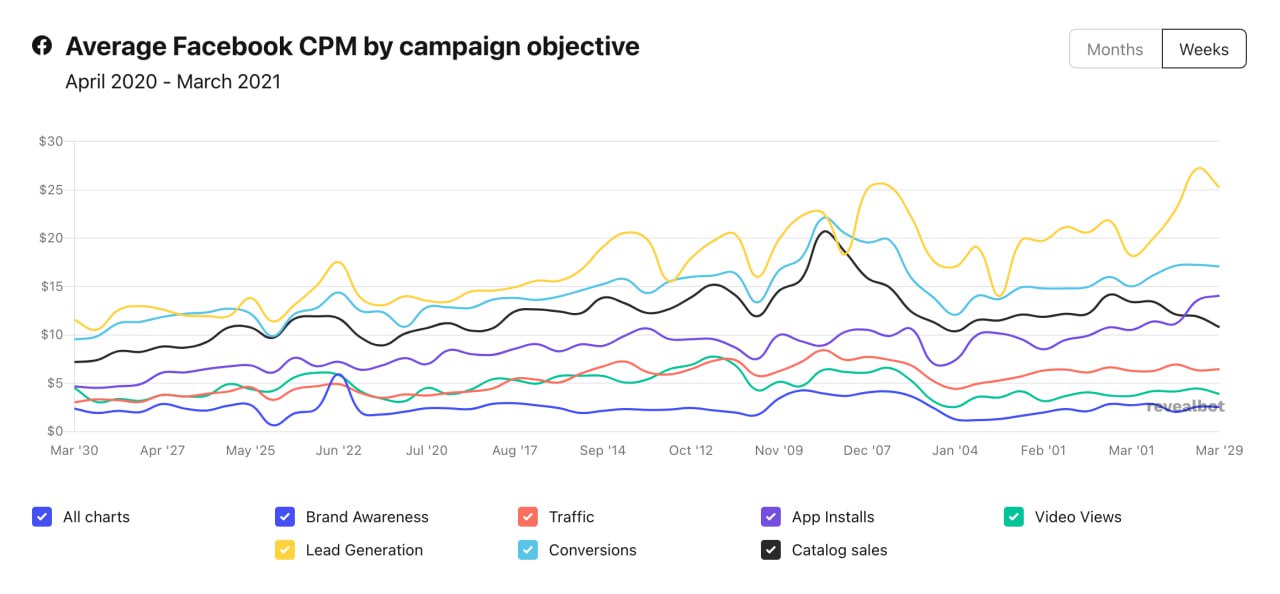
Average Facebook CPM by objective, April 2020 – March 2021.
Challenge
Clients kept asking 'why is my CPM so high?' without context. There was no internal benchmark to push back against unrealistic objective choices.
Strategy
- —Pull 12 months of CPM data per campaign objective
- —Visualise as a weekly trend, not a single average
- —Use it to recommend objective swaps when CPM is the bottleneck
- —Re-run quarterly to track the auction shifting
Execution
- —Lead Generation CPMs trended highest — up to $27
- —Conversions and Brand Awareness ran $15–22
- —Video Views, Traffic and App Installs sat under $7
- —Used the chart in every quarterly client review
The story
“Half of CPM problems aren't budget problems — they're objective problems. Lead Gen consistently runs 4–5× the CPM of App Installs in the same auction. Building this benchmark gave every client a defensible answer to 'why are we paying that much?' — and a clear path to a cheaper objective when one exists.”
Key takeaways
Objective choice drives CPM more than creative
Benchmark internally — don't rely on industry averages
Swap objectives when CPM, not CPA, is the blocker