7 campaigns, 5 channels, one source of truth
Unified pixel + server-side tracking across Google, Meta, TikTok, Pinterest and Snapchat — $816 spend, 2.59× blended ROAS.
Overview
This is a Google + Meta + TikTok + Pinterest + Snap case study for a dtc ecommerce client, run by Muhammad Naveed over 7-day window. The headline result was 2.59× blended roas. Unified pixel and server-side tracking across Google, Meta, TikTok, Pinterest and Snapchat — 2.59x blended ROAS.
Attribution was a mess. Google Ads claimed one number, Meta claimed another, and the founder had no idea what was actually profitable. Channel overlap was hiding the truth.
The numbers, side by side.
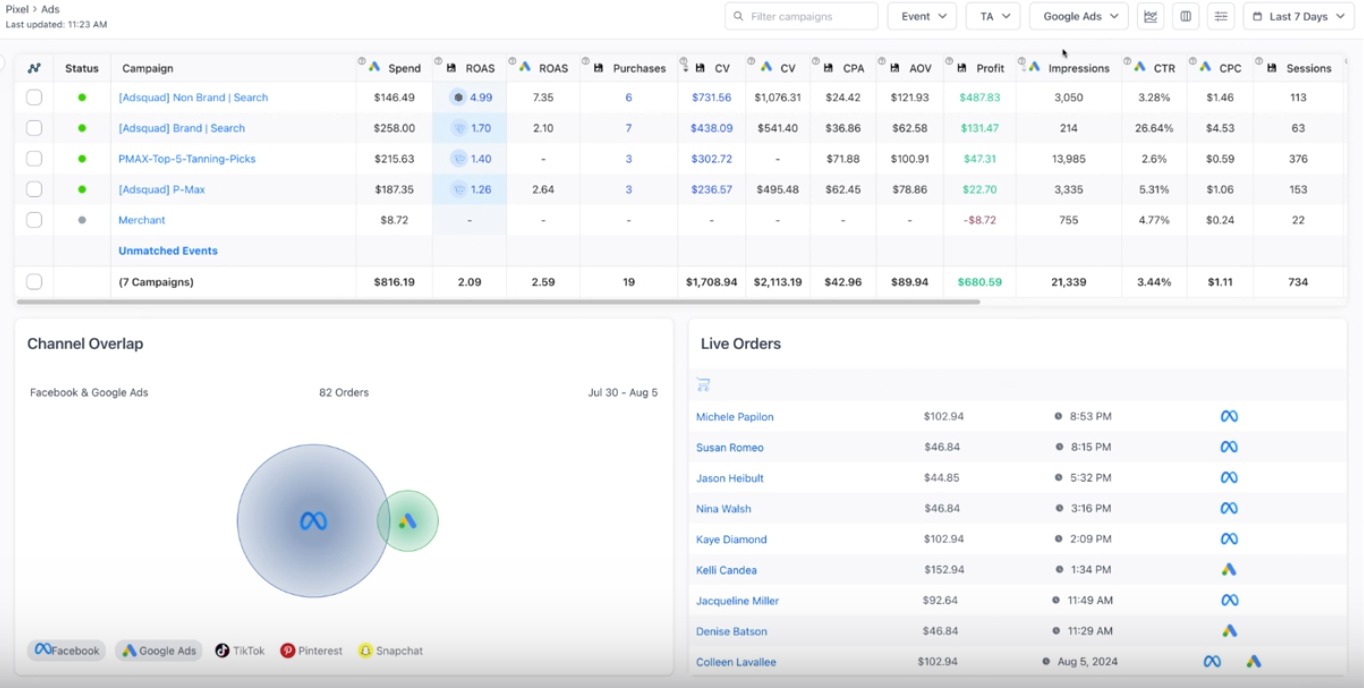
7-campaign attribution dashboard with live order feed and channel overlap.
Challenge
Attribution was a mess. Google Ads claimed one number, Meta claimed another, and the founder had no idea what was actually profitable. Channel overlap was hiding the truth.
Strategy
- —Single server-side pixel feeding every platform
- —Channel-overlap analysis to find double-attributed orders
- —Profit-per-campaign view, not just ROAS
- —Live order stream tied back to the originating channel
Execution
- —Brand Search held a 7.35× ROAS at $146 spend
- —Non-Brand Search delivered $487 profit on $146 spend
- —PMax + P-Max combined drove 9 of 19 purchases
- —82 orders mapped across Facebook ↔ Google Ads overlap
The story
“When the founder asked 'which channel is actually making money?' nobody had an answer. We rebuilt the tracking layer end-to-end: one server-side pixel, one attribution model, one profit column. Suddenly Brand Search was clearly a 7.35× winner, PMax-Top-5 was a 1.40× drag, and Merchant was bleeding. $816 of spend, $680 of profit — and a founder who finally trusted the numbers.”
Key takeaways
Server-side pixel ends the platform-vs-platform argument
Profit per campaign > ROAS per campaign
Channel overlap is usually where the budget leak hides